There was a slight increase in the number of sources that issue priming queries to DNS root servers seen on 18 March 2010, right after the introduction of a signed .arpa zone. See here an analysis and some graphs.
I looked a bit more at the slight increase in the number of sources that issue priming queries to DNS root servers I saw on 18 March, right after the introduction of a signed .arpa zone. The short summary is that I didn't find anything conclusive.
The increase I saw was caused by a couple of K-root nodes and was most visible on the AMS-IX (Amsterdam, Netherlands) node and the MIX (Milan, IT) node, but not on all nodes. For the AMS-IX and MIX node I found that the increase was caused by sources that had an IP TTL between 64 and 128, and these sources didn't have EDNS, so no DNSSEC capabilities.
I looked at priming queries collected by others as part of DNS-OARC . For the aggregate of root server nodes that data was available for, there is no increase in number of sources sending priming queries per day (Figure 1).
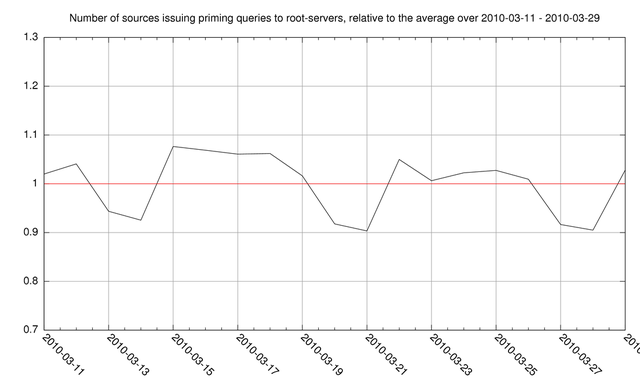
Figure 1: Number of priming queried to root-servers
When looking at the individual instances of specific root servers, in some cases you can see an increase (L-root), a decrease (E-root), or no change (D-root, H-root) around 18 March.
So at this point the most likely explanation for the increase of sources issuing priming queries to K-root that we reported earlier, is that some population of resolvers started to query K-root a bit more often, relative to the other root servers.
Below are some IMHO aesthetically pleasing pictures of the number of sources issuing priming queries to root server nodes, relative to the average for the specific node over the period that is plotted (2010-03-11 - 2010-03-29).
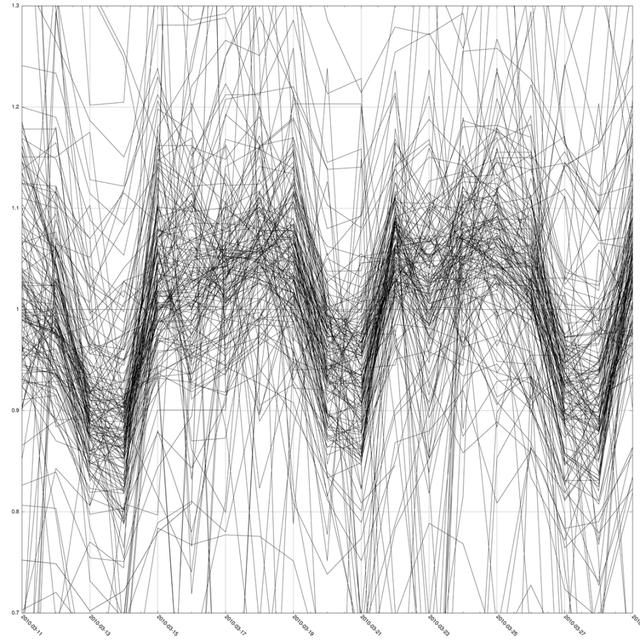
Figure 2: Number of sources issuing priming queries relative to the average, for all root server nodes that uploaded data to DNS-OARC
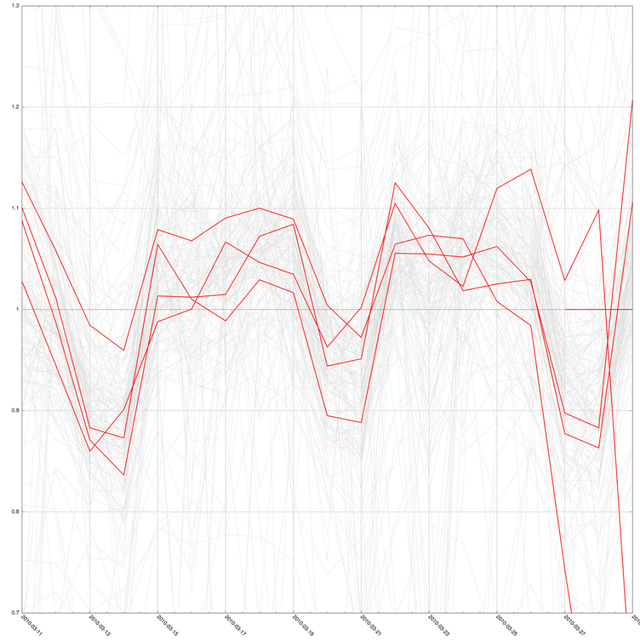
Figure 3: Number of sources issuing priming queries relative to the average, A-root nodes highlighted
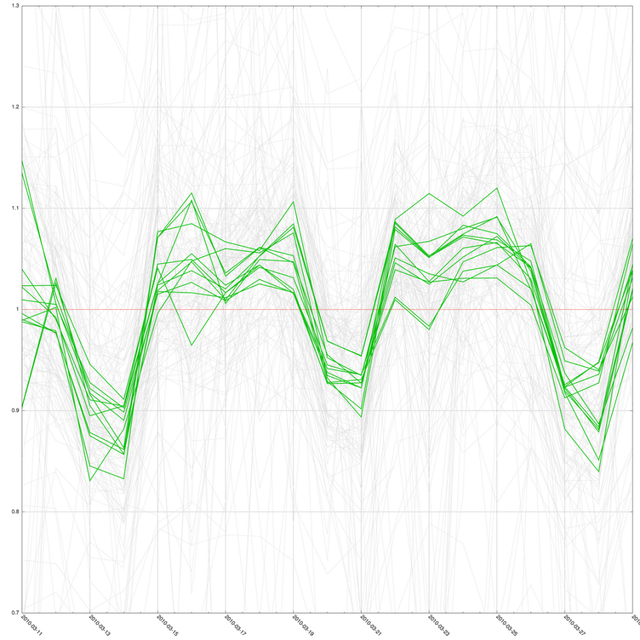
Figure 4: Number of sources issuing priming queries relative to the average, C-root nodes highlighted
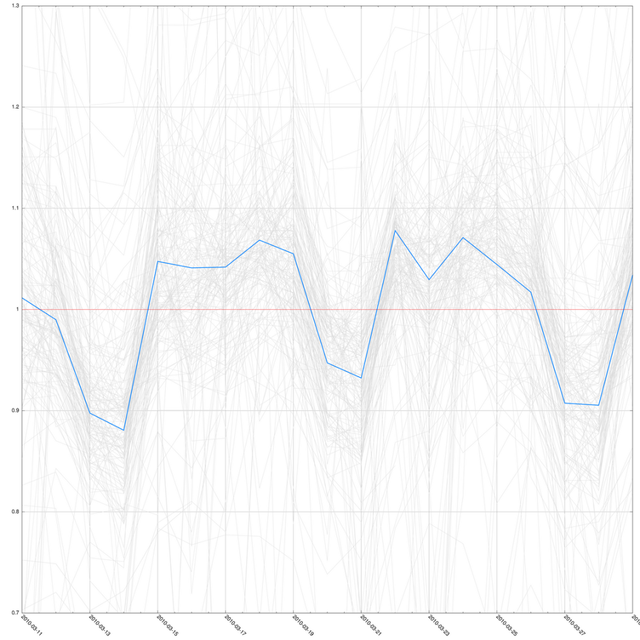
Figure 5: Number of sources issuing priming queries relative to the average, D-root node highlighted
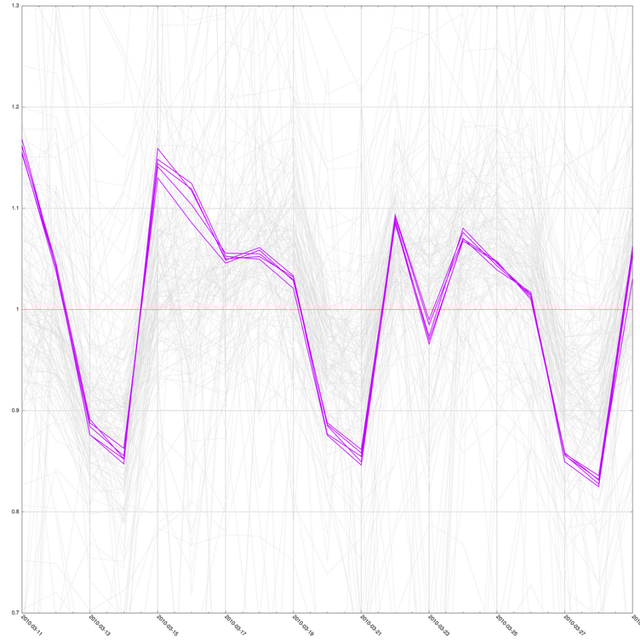
Figure 6: Number of sources issuing priming queries relative to the average, E-root nodes highlighted
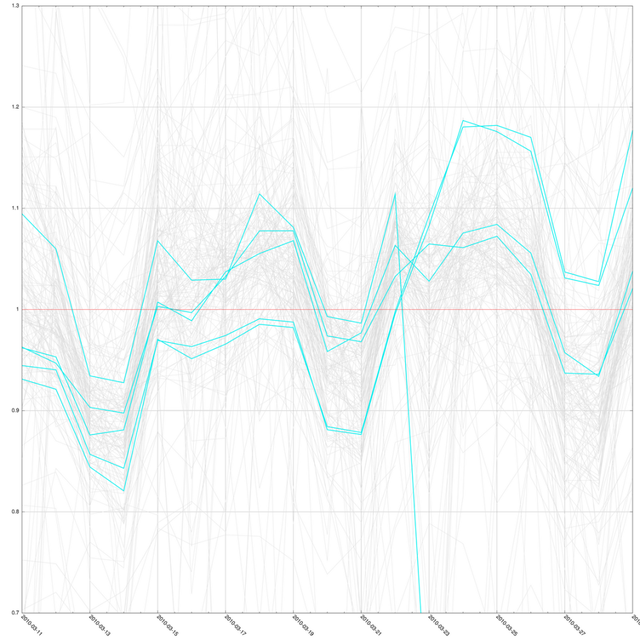
Figure 7: Number of sources issuing priming queries relative to the average, F-root nodes highlighted
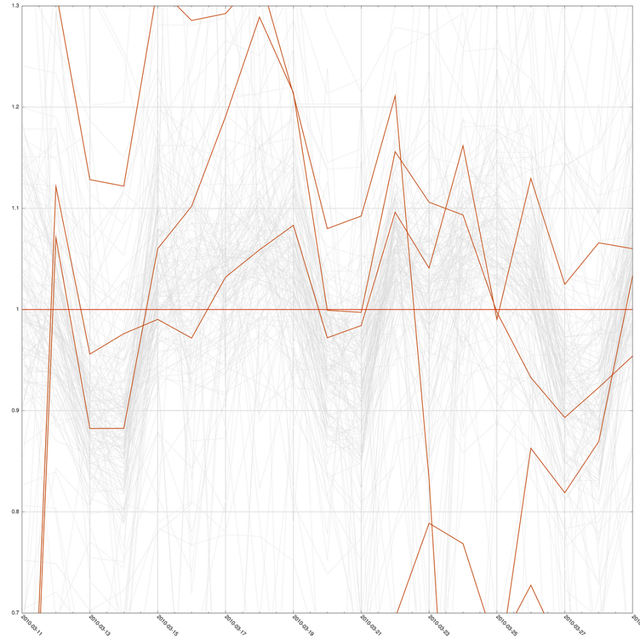
Figure 8: Number of sources issuing priming queries relative to the average, G-root nodes highlighted
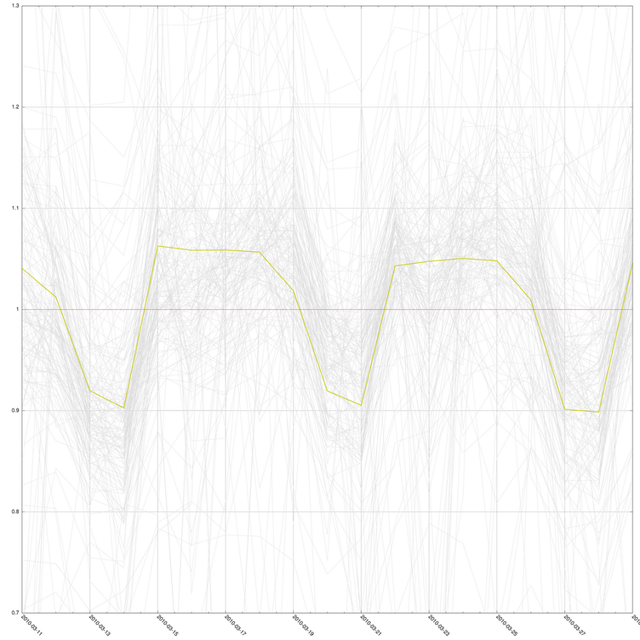
Figure 9: Number of sources issuing priming queries relative to the average, H-root node highlighted
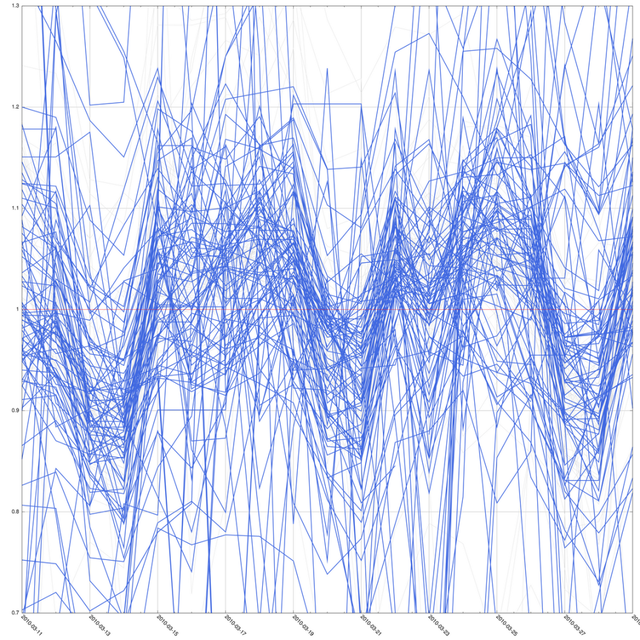
Figure 10: Number of sources issuing priming queries relative to the average, J-root nodes highlighted
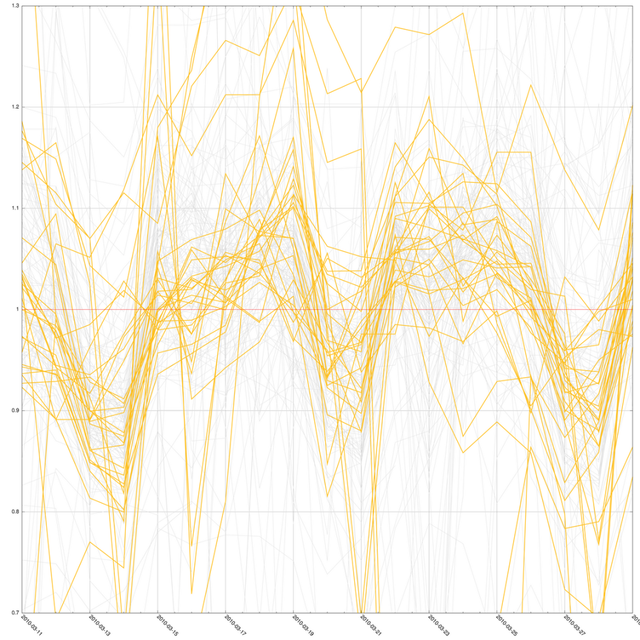
Figure 11: Number of sources issuing priming queries relative to the average, K-root nodes highlighted
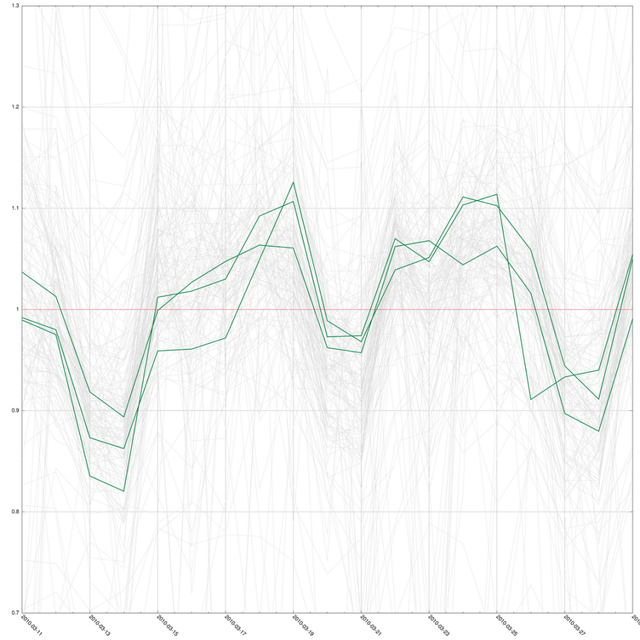
Figure 12: Number of sources issuing priming queries relative to the average, L-root nodes highlighted
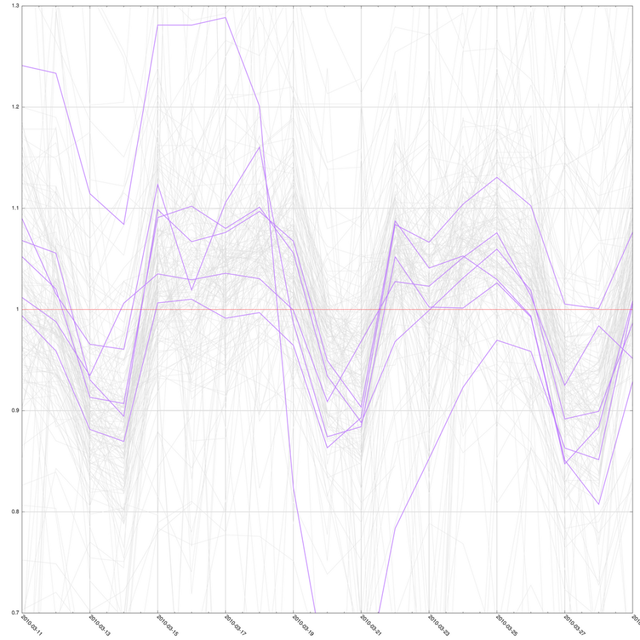
Figure 13: Number of sources issuing priming queries relative to the average, M-root nodes highlighted


Comments 0
Comments are disabled on articles published more than a year ago. If you'd like to inform us of any issues, please reach out to us via the contact form here.