We look at the consumption rate of 16-bit ASNs and try to make an educated guess on how long they would last if the current allocation rules would be extended.
The RIPE NCC has been issuing 32-bit (also known as four-byte) AS Numbers by default, unless otherwise requested, since 1 January 2009. However, uptake of 32-bit ASNs has been slow and many 32-bit AS Numbers have been returned.
We look at the consumption rate of 16-bit ASNs and try to make an educated guess on how long they would last if the current allocation rules would be extended.
The Straightforward Approach
The RIRs publish statistics on IP and AS number delegations on a daily basis. For ASNs, the records in these files have the following format:
registry|cc|asn|start|count|allocation_date|status
Taking the latest data from each RIR will show when each ASN was allocated. Naively, one could think that a simple cumulative plot, showing the number of ASNs in the latest stats files as a function of the allocation date would provide the desired information. However, this is not the case. Managing ASN allocations is a dynamic process. RIRs not only hand out AS numbers, they also receive back previously issued AS numbers, returned by the respective ASN holders; reasons for this are a.o. merger of networks (two Autonomous systems merged into one), bad debts leading to LIR closure etc. After some quarantine period, the returned ASNs become available for reallocation.
Thus, each stats file provides a snapshot of the current state. For each ASN it records the latest allocation date. Because an RIR stats file does not contain information on how many ASNs were returned over time, it provides an incomplete picture of the depletion rate of the free pool.
The ASNMIA analysis of 2005 showed the fraction of returned ASNs started to have measurable effects on the depletion rate in 2005. The increase in demand for new ASNs was offset by handing out recycled ASNs. Although the latest allocation date suggested slight exponential growth, the net increase at that time was still linear, thanks to this recycling.
A Better Approach
At any point in time, we define the size of the free pool as follows:
Free = Total ASN16 space - special purpose blocks - RIR allocations
where
Total ASN16 space = 65536
special purpose blocks = 1042 (private AS + documentation purposes + ASTRANS)
Because the RIRs only publish daily snapshots, where allocation dates have changed due to recycling, we use the data published in historic stats files as an estimate for the RIR allocations. I.e. for each time t , with t > 2004-01-01 , the quantity <total RIR allocations> is defined as the total count of 16-bit ASNs seen in the collective RIR stats files for that time. Note that in this definition the free pool also includes those ASNs which have been returned, but are not yet available for reallocation because of a quarantine period or because they are still referenced. (for example, for RIPE NCC we see on 2009-05-05 the /ncc/ip-reg/as file lists 245 ASNs as REFERENCED ... NOT AVAILABLE ). This produces the following graph:
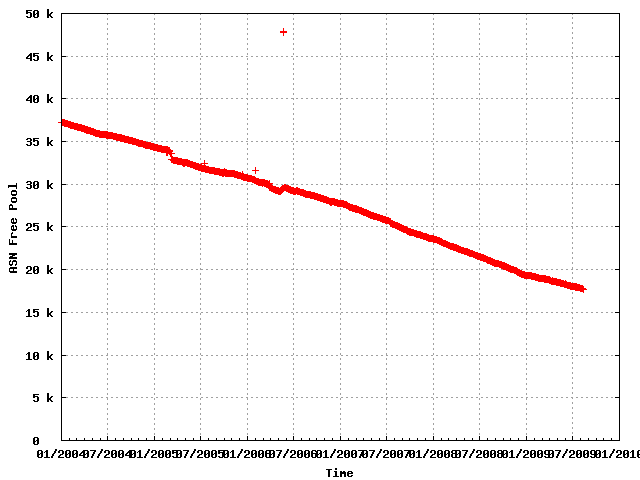
The clear outliers are caused by missing stats files for some dates.
Extrapolation and "Exhaustion Date"
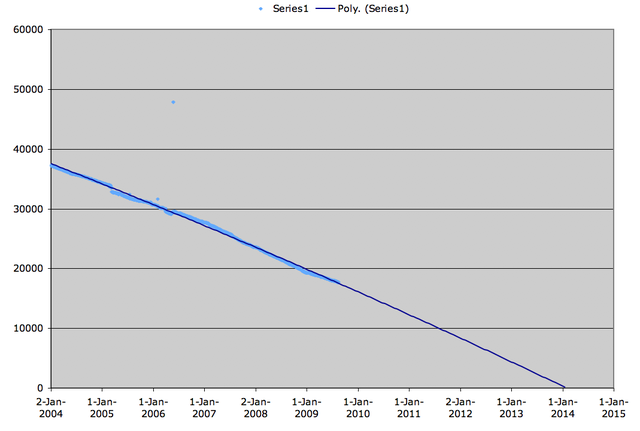
Microsoft Excel's graphing package includes options to add trendlines to data series. Using a polynomial fit on the daily values from 2004-01-01 to 2009-08-14, the ASN16 pool would be exhausted around January 2014:
Only Most Recent Recent Data
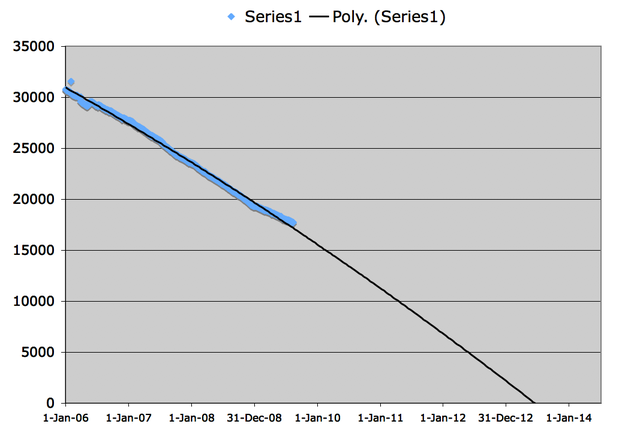
One could argue that the fit above includes too many historic data points. Since the Internet has grown, lower allocation rates of 4, 5 years ago would overestimate the projected lifetime of the remaining ASN16 pool. To address this, we also made a polynomial fit to the data series of the last 3 years, from 2006-01-01 to 2009-08-14. This fit projects exhaustion by the middle of 2013:

Credits
Research and Analysis : René Wilhelm
Editing : Daniel Karrenberg
This analysis was first presented briefly at RIPE 58. The graphs were updated with August 2009 data.



Comments 3
The comments section is closed for articles published more than a year ago. If you'd like to inform us of any issues, please contact us.
Anonymous •
<div class="content legacycomment"> <p> This model of AS number consumption presented in the article appears to assume that the remaining AS number pool is a common resource to the set of RIRs. so what it looks for is the data when the pool is exhausted assuming "perfect" consumption. </p> <p> </p> <p> However, this is not the world as we know it, and a more detailed model needs to model the actions of the IANA and the individual RIRs. Each RIR has a pool of AS numbers, and when they get to a low threshold they request another block of numbers from the IANA. The low threshold appears to vary with each RIR, and the amount of AS numbers provided by the IANA is the number of addresses needed to provide for the next 12 months. </p> <p> </p> <p> <a href="http://www.icann.org/en/general/global-policy-asn-blocks-31jul08-en.htm" title="http://www.icann.org/en/general/global-policy-asn-blocks-31jul08-en.htm"> http://www.icann.org/en/general/global-policy-asn-blocks-31jul08-en.htm </a> </p> <p> </p> <ol> <p style="font-size: small; "> An RIR is eligible to receive (an) additional ASN block(s) from the IANA if one of the following conditions is met: </p> <ol> <li style="font-size: small; "> The RIR has assigned or allocated 80% of the previously received ASN block; or </li> <li style="font-size: small; "> The number of free ASNs currently held by the RIR is less than its two month need. This projection is based on the monthly average number of ASNs assigned or allocated by the RIR over the previous six months. </li> </ol> <p style="font-size: small; "> An RIR will be allocated as many ASN blocks as are needed to support their registration needs for the next 12 months, based on their average rate of assignment or allocation over the previous six months, unless the RIR specifically requests fewer blocks than those for which it qualifies. </p> </ol> <p> </p> <p> So the refinement to the exhaustion question is: </p> <p> </p> <p> -- when will the IANA pool of 16 bit ASNs exhaust? </p> <p> </p> <p> -- when will each RIR exhaust its locally managed pool of 16-bit ASNs? </p> <p> </p> <p> These questions have motivated the predictions made at http://www.potaroo.net/tools/asn16/. This is a model of AS number consumption that specifically includes the RIRs actions and their own locally managed pools of AS numbers into the predictive model. The result is that the current consumption data points to exhaustion starting to occur in 2011. with IANA making its final allocation to an RIR (ARIN) in early 2011 and the first RIR will exhaust its local pool of numbers in October 2011, namely the RIPE NCC on the 20th October 2011. </p> <p> </p> <p> Geoff </p> <p> </p> </div>
Anonymous •
<div class="content legacycomment"> <p> Hi Geoff, </p> <p> </p> <p> I am glad to see some substantial discussion here. I am sure it will spread well beyond the "Chief Scientist" trade union. </p> <p> </p> <p> I like the work you present on <a href="http://www.potaroo.net"> potaroo </a> very much, especially its deductive rigor and the fact that it is all nicely automated and updated daily. This is great and useful to the community. We looked at your ASN16 data of course and René referenced it in his analysis. It is entirely my fault that the reference did not make it into the article here and I plead guilty to the charge of oversight caused by the frentic rush to get RIPE Labs operational. I will add an appropriate reference. </p> <p> </p> <p> We did this particular analysis not to improve on yours, which will be hard to do in any aspect. We did it to convince ourselves by way of our own much simpler analysis that we end up in the same ballpark. Independent analysis increases confidence in the factual basis for policy making. As noted in the article we found that it was not sufficient to base our analysis on the latest version of the RIR "stats" files as the allocation dates for re-issued ASNs in that file lead us to over-estimate the allocation rate. How does your analysis deal with that? </p> <p> </p> <p> Figure 19 of <a href="http://www.potaroo.net/tools/asn16/"> your analysis </a> looks remarkably similar to our result. I reproduce today's version here: </p> <p> </p> <p> </p> <p> It comes down to choosing the extrapolation method. The choice is actually pretty arbitrary, the data does not give a strong indication which method predicts the future better. Or does it? In any case two independent analyses of the same data show results that are similar enough to give us confidence in these results. </p> <p> </p> <p> What your work does show however, and what has now attracted our attention, is the substantial increase of the allocation rate in the RIPE region over the last several years, best observed in your figure 9. I reproduce today's version again here for the record: </p> <p> </p> <p> </p> <p> I will not speculate about the reasons here but will look into that as soon as we return from the RIPE meeting and we will publish our findings here. So watch this space. </p> <p> </p> <p> Daniel </p> </div>
random observer •
According to AFRINIC IANA have announced their pool is now depleted, August 2016.